Are You Really
"Watching" Short Videos?

Billions of short videos are consumed daily. But how much of each video do users actually watch? How different is the experience when the algorithm picks the video versus when it doesn't?

Using the KuaiRand dataset — a natural experiment on Kuaishou where random videos were inserted into the algorithmic feed[1] — we explore what user behavior actually looks like when the algorithm's curation is removed, even briefly.

A Hidden Experiment Inside the Feed

KuaiRand embeds a controlled intervention into a live platform: while users browse their normal recommendation feed, approximately 0.4% of videos are replaced with randomly selected content — bypassing the algorithm entirely[1]. Both types of events coexist within the same browsing session.

~1,000 Users
12M+ Standard events
~43K Random events

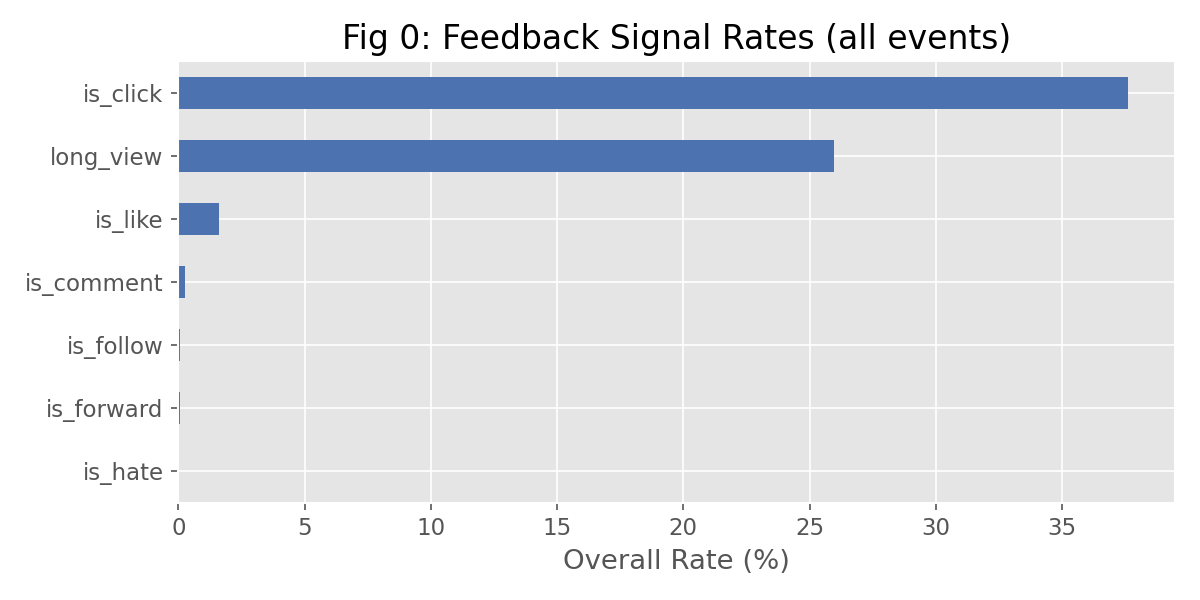
The chart below shows how frequently each type of user feedback occurs across all interactions. Click and long-view are the dominant signals; social behaviors like follow or comment are extremely rare (<2%).

Feedback signal rates across all events
Figure 1. Overall feedback signal rates. is_click (~37%) and long_view (~25%) are the primary engagement signals. Social interactions like follow, comment, and forward are each below 0.5%.

The Algorithm Picks Videos Users Actually Engage With

We expected some gap between algorithm-recommended and randomly-inserted videos — but the magnitude was striking. Across every measured behavior, users engage 2–3× more with algorithm-selected content.

Engagement comparison: algorithm vs random
Figure 2. Long View Rate: 26.1% vs 8.4%. Click Rate: 37.7% vs 17.4%. The algorithm consistently selects videos that users are far more likely to watch and interact with.

But even algorithm-recommended videos are mostly skipped quickly. The cumulative distribution of play ratio reveals a universal pattern: the first few seconds decide everything.

Play ratio CDF: algorithm vs random
Figure 3. 60% of random video interactions have a play ratio under 5% — users barely glance. Even for algorithm videos, the median completion is only ~11%. Short video content lives or dies in its opening seconds[2].
Key insight: The algorithm is effective at selecting content that holds attention longer. But "longer" is relative — most videos, regardless of source, are abandoned within seconds.

Does the Feed Narrow Over Time? The Data Says No.

A common concern about recommendation algorithms is the "filter bubble" — the idea that algorithms progressively narrow the content users see, trapping them in an echo chamber[3]. We tested this by measuring content category diversity within individual browsing sessions.

Content diversity: first half vs second half
Figure 4. Average unique categories in the first vs second half of each session (algorithm events only). Across all activity levels, the second half shows equal or slightly more diversity — not less.

Zooming into the sequence-level view reinforces this. The share of the single most popular category actually decreases as the session progresses.

Top-1 category share by sequence position
Figure 5. Top-1 category share drops sharply from ~20% at position 1 to ~12–15% by position 10, then stabilizes. The algorithm diversifies content within a session, not the opposite.
Key insight: Within a single session, we found no evidence of a "filter bubble." Content variety holds steady or increases slightly. However, this does not rule out narrowing effects over longer time scales — weeks, months, or across sessions[3].

1,000 Users, 1,000 Different Content Worlds

Aggregate patterns only tell part of the story. At the individual level, each user's content diversity and viewing behavior varies widely. The following two views — one static, one interactive — show this user-level variation.

Per-user content diversity scatter
Figure 6a. Each dot = one user. X-axis: unique categories via random videos; Y-axis: via algorithm videos. Most dots sit far above the diagonal because users receive far more algorithm events. High-activity users (red) see more diverse content from the algorithm.
Figure 6b. Each dot = one user. Most sit above the diagonal — the same user watches algorithm-recommended videos more completely than random ones. Hover to see individual Play Ratio and Long View Rate values.

The Rhythm of a Day, in Swipes

User engagement is not uniform throughout the day. The heatmap below shows how key feedback signals fluctuate across 24 hours. Look for patterns: do users watch more attentively late at night? Does click behavior peak at certain hours?

Figure 7. Hourly feedback patterns across all events. Darker cells = higher rate. Hover for exact percentage values at each hour.

What We See, and What We Can't

What the data shows:

The algorithm is remarkably good at selecting videos that users engage with — 2–3× higher engagement across all metrics. But even with this advantage, the median play ratio for algorithm-recommended videos is only ~11%. Most short videos are abandoned within seconds, regardless of how they were selected.

Within individual browsing sessions, we found no evidence of content narrowing. Category diversity is maintained or slightly increases as sessions progress — a finding that challenges the simple "filter bubble" narrative, at least at the within-session time scale.

What we cannot conclude:

For full methodology, code, and detailed analysis, see the Explainer Notebook.

References

  1. [1] Gao, C., Li, S., Lei, W., et al. "KuaiRand: An Unbiased Sequential Recommendation Dataset with Randomly Exposed Videos." Proceedings of the 31st ACM International Conference on Information & Knowledge Management (CIKM), 2022. kuairand.com
  2. [2] Zhao, Z., et al. "Recommending What Video to Watch Next: A Multitask Ranking System." Proceedings of the 13th ACM Conference on Recommender Systems (RecSys), 2019.
  3. [3] Pariser, E. The Filter Bubble: What the Internet Is Hiding from You. Penguin Press, 2011.
  4. [4] Ribeiro, M.H., Ottoni, R., West, R., Almeida, V.A.F., and Meira, W. "Auditing Radicalization Pathways on YouTube." Proceedings of the 2020 Conference on Fairness, Accountability, and Transparency (FAT*), 2020.
  5. [5] Segel, E. and Heer, J. "Narrative Visualization: Telling Stories with Data." IEEE Transactions on Visualization and Computer Graphics, 16(6), 2010. PDF
  6. [6] Gao, C., Li, S., et al. "KuaiRec: A Fully-observed Dataset and Insights for Evaluating Recommender Systems." CIKM, 2022.